Jump to: PT Calculator · R410A High/Low Side · R-410A Chart · R-22 Chart · How to Read a PT Chart · Superheat & Subcooling · Target Superheat Chart · Practice Problems · FAQ
Interactive PT Chart Calculator
Select a refrigerant and convert in either direction: gauge pressure (PSIG) to saturation temperature, or temperature to pressure. Results are interpolated linearly from the verified chart below. The calculator will not extrapolate outside the −40°F to 150°F data range.
Pressures are PSIG at sea level. R-22 and R-410A results are dew-point based (R-410A glide is under 0.3°F). R-404A results show both bubble point (use for subcooling) and dew point (use for superheat). No JavaScript? Use the full static chart below.
R410A Pressure Chart: High and Low Side
Quick answer: the low side pressure converts to evaporating saturation temperature and is paired with suction-line temperature to calculate superheat. The high side pressure converts to condensing saturation temperature and is paired with liquid-line temperature to calculate subcooling. There is no single normal R410A running pressure.
| Reading | Low side / suction | High side / liquid |
|---|---|---|
| Service connection | Larger insulated suction line | Smaller liquid line |
| PT chart gives | Evaporating saturation temperature (SST / VSAT) | Condensing saturation temperature (SCT / LSAT) |
| Measure next | Suction-line temperature | Liquid-line temperature |
| Calculate | Actual superheat = line temperature − saturation temperature | Actual subcooling = saturation temperature − line temperature |
| Charging method | Usually fixed-orifice / piston systems | Usually TXV / EEV systems |
R410A Static Pressure vs Running Pressure
When an R410A system is off long enough to equalize, both gauges should approach the saturation pressure for the refrigerant temperature. Outdoor air temperature is not automatically the refrigerant temperature.
| Equalized refrigerant temperature | R410A static pressure |
|---|---|
| 70°F | 201.1 PSIG |
| 80°F | 235.7 PSIG |
| 90°F | 274.5 PSIG |
| 95°F | 295.4 PSIG |
| 100°F | 317.6 PSIG |
Do not use this as a running-pressure chart. Operating pressures change with indoor load, outdoor conditions, airflow, equipment design, metering device and charge. Compare calculated superheat or subcooling with the manufacturer’s charging data.
R410A Running-Pressure Example
For a teaching example only: a correctly charged, mid-efficiency R410A air conditioner at 75°F indoor air, about 50% RH and 95°F outdoors, with clean coils and rated airflow, might show 115–125 PSIG suction pressure (about 38–42°F evaporating) and 340–390 PSIG head pressure (about 105–115°F condensing). Change any assumption and the valid readings can change.
R-410A & R-22 Pressure Temperature Chart
Every HVAC technician needs an accurate PT chart in their pocket. The table below covers −40°F to 150°F and shows the relationship between saturation temperature (°F) and gauge pressure (PSIG) for the three most common refrigerants. We have highlighted two chart checkpoints that come up constantly in exam problems and field checks.
R-410A PT Chart Checkpoints
- Blue (40°F): A common evaporator saturation temperature for A/C — about 118 PSIG on R-410A.
- Orange (105°F–110°F): A common condensing saturation range — about 341–365 PSIG on R-410A.
R-22 PT Chart Checkpoints
- At a 40°F evaporator saturation temperature, R-22 reads about 69 PSIG — roughly half the R-410A pressure at the same temperature.
- At a 105°F condensing saturation temperature, R-22 reads about 211 PSIG.
| Temp (°F) | R-22 (PSIG) | R-410A (PSIG) | R-404A Liquid / Bubble (PSIG) | R-404A Vapor / Dew (PSIG) |
|---|---|---|---|---|
| -40 | 0.6 | 10.7 | 4.9 | 4.3 |
| -30 | 4.9 | 17.7 | 10.3 | 9.6 |
| -20 | 10.2 | 26.2 | 16.8 | 16.0 |
| -10 | 16.5 | 36.3 | 24.6 | 23.6 |
| 0 | 24.0 | 48.2 | 33.7 | 32.6 |
| 5 | 28.3 | 54.9 | 38.8 | 37.7 |
| 10 | 32.8 | 62.2 | 44.3 | 43.1 |
| 15 | 37.8 | 70.0 | 50.2 | 49.0 |
| 20 | 43.1 | 78.4 | 56.6 | 55.3 |
| 25 | 48.8 | 87.4 | 63.4 | 62.1 |
| 30 | 55.0 | 97.0 | 70.7 | 69.3 |
| 32 | 57.5 | 101.1 | 73.8 | 72.4 |
| 34 | 60.2 | 105.2 | 77.0 | 75.5 |
| 36 | 62.9 | 109.5 | 80.2 | 78.7 |
| 38 | 65.7 | 113.9 | 83.5 | 82.0 |
| 40 (Evap) | 68.6 | 118.4 | 86.9 | 85.4 |
| 42 | 71.5 | 123.0 | 90.4 | 88.8 |
| 44 | 74.5 | 127.7 | 94.0 | 92.4 |
| 46 | 77.6 | 132.6 | 97.6 | 96.0 |
| 48 | 80.8 | 137.5 | 101.4 | 99.8 |
| 50 | 84.1 | 142.6 | 105.3 | 103.6 |
| 52 | 87.4 | 147.9 | 109.2 | 107.5 |
| 54 | 90.8 | 153.2 | 113.3 | 111.6 |
| 56 | 94.4 | 158.7 | 117.4 | 115.7 |
| 58 | 98.0 | 164.4 | 121.7 | 119.9 |
| 60 | 101.6 | 170.1 | 126.0 | 124.2 |
| 65 | 111.2 | 185.1 | 137.3 | 135.5 |
| 70 | 121.4 | 201.1 | 149.3 | 147.4 |
| 75 | 132.2 | 217.9 | 162.0 | 160.1 |
| 80 | 143.6 | 235.7 | 175.4 | 173.4 |
| 85 | 155.7 | 254.6 | 189.5 | 187.5 |
| 90 | 168.4 | 274.5 | 204.5 | 202.4 |
| 95 | 181.8 | 295.4 | 220.2 | 218.1 |
| 100 | 195.9 | 317.6 | 236.8 | 234.7 |
| 105 | 210.8 | 340.8 | 254.2 | 252.1 |
| 110 | 226.4 | 365.4 | 272.6 | 270.4 |
| 115 | 242.8 | 391.2 | 291.8 | 289.7 |
| 120 | 260.0 | 418.3 | 312.1 | 309.9 |
| 130 | 296.9 | 476.8 | 355.7 | 353.6 |
| 140 | 337.4 | 541.5 | 403.7 | 401.7 |
| 150 | 381.7 | 613.0 | 456.8 | 455.0 |
*Pressures are in PSIG at sea level (14.696 psia). R-22 and
R-410A columns are dew-point values; R-410A’s temperature glide is under 0.3°F, so a
single column applies to both superheat and subcooling work. R-404A is a zeotropic blend: use
the Liquid/Bubble column for subcooling and the Vapor/Dew
column for superheat.
Data source: computed with the open-source CoolProp thermophysical property
library (REFPROP-comparable equations of state), rounded to 0.1 PSIG. Last
verified: July 30, 2026.
How to Read a PT Chart for R410A
Understanding the basics is crucial. A standard R-410A PT chart tells you the "Saturation Temperature." This is the temperature where the refrigerant is changing state (boiling from liquid to vapor, or condensing from vapor to liquid).
When your gauge manifold reads a specific pressure (e.g., 118.4 PSIG on R-410A), you look at the chart to find the corresponding saturation temperature (40°F). If the actual pipe temperature matches this, the system is saturated. You can also use the calculator above to interpolate between chart rows.
What Is Saturation Temperature in HVAC?
Saturation temperature is the temperature at which refrigerant boils or condenses at a given pressure. Read pressure on the gauge, convert it with the PT chart, then compare that saturation temperature with the measured pipe temperature.
While refrigerant is changing state, pressure and temperature are locked together — know one, and the PT chart gives you the other. That relationship turns a gauge pressure into a temperature you can use for superheat and subcooling.
Two saturation temperatures matter on a running system:
- Evaporating temperature (low side): the saturation temperature that corresponds to your suction pressure.
- Condensing temperature (high side): the saturation temperature that corresponds to your liquid-line (head) pressure.
VSAT, LSAT, SST and SCT Meanings
| Gauge term | Meaning | How it is used |
|---|---|---|
| VSAT | Vapor saturation temperature (dew point) | Use with suction-line temperature for superheat. |
| LSAT | Liquid saturation temperature (bubble point) | Use with liquid-line temperature for subcooling. |
| SST | Saturated suction temperature | Low-side evaporating saturation temperature. |
| SCT | Saturated condensing temperature | High-side condensing saturation temperature. |
How to Find Saturation Temperature in 3 Steps
- Step 1: Connect your gauge manifold to the service port (low side for evaporating temperature, high side for condensing temperature).
- Step 2: Read the gauge pressure in PSIG.
- Step 3: Convert pressure to temperature using the calculator or the chart above.
R410A Superheat & Subcooling Chart and Calculators
You cannot charge a system correctly without calculating these values. You simply cross-reference the pressure on your R-410A PT chart to find the saturation temp, then use these formulas:
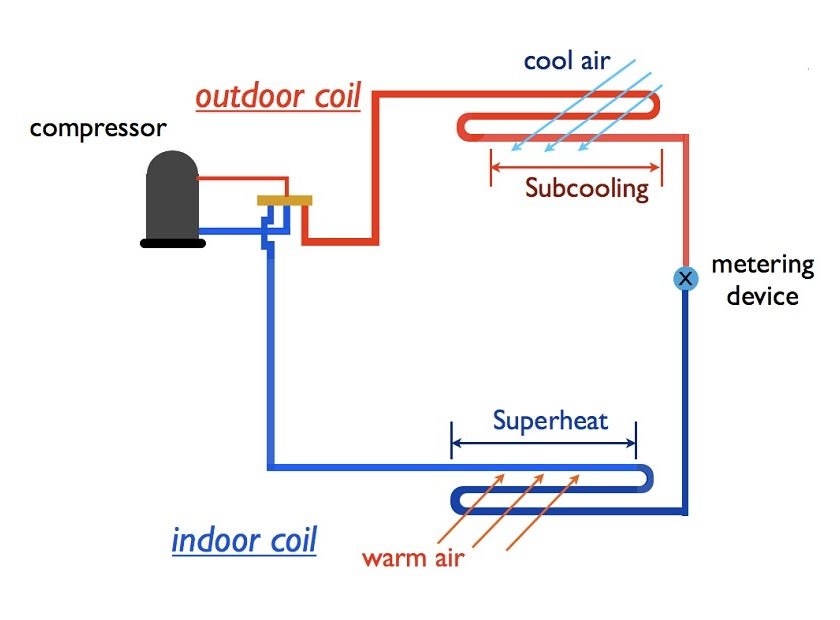
Measure Superheat at the suction line (low side) and Subcooling at the liquid line (high side).
| Task | Gauge / PT value | Pipe measurement | Formula |
|---|---|---|---|
| Actual superheat | Low-side pressure → dew / evaporating temperature | Suction-line temperature | Line temp − saturation temp |
| Actual subcooling | High-side pressure → bubble / condensing temperature | Liquid-line temperature | Saturation temp − line temp |
1. Superheat (Fixed Orifice)
Ensures only vapor enters the compressor.
- Formula: Actual Suction Line Temp - Saturation Temp (from chart) = Superheat.
- Target: Typically 10°F - 20°F (Check manufacturer specs).
2. Subcooling (TXV)
Ensures a full column of liquid reaches the metering device.
- Formula: Saturation Temp (from chart) - Actual Liquid Line Temp = Subcooling.
- Training range: 8°F - 12°F is a common teaching range — the manufacturer’s nameplate or charging data always takes precedence.
Superheat Calculator (Actual)
Enter your suction pressure and the measured suction line temperature. The calculator finds the saturation temperature from the verified chart and subtracts it for you.
Subcooling Calculator (Actual)
Enter your liquid line (high side) pressure and the measured liquid line temperature.
R410A and R22 Target Superheat Chart (Fixed-Orifice Systems)
This method applies to fixed-orifice (piston) systems only. TXV-equipped systems maintain superheat on their own and are charged by subcooling instead. For a fixed-orifice system, the correct superheat is not one number — it moves with the load, so you calculate a target from two field measurements:
- Outdoor dry-bulb temperature (ODB) — measured in the shade at the condenser air inlet.
- Indoor return-air wet-bulb temperature (IWB) — measured at the return grille with a wet-bulb or psychrometer reading.
A long-standing industry rule of thumb taught in NATE prep estimates the target as Target Superheat = (3 × IWB − 80 − ODB) ÷ 2. Manufacturer charging charts, where available, always take precedence over this formula.
The target is determined by system load and metering-device type, not by whether the refrigerant is R410A or R22. Use the same matrix for either refrigerant, then use the correct PT chart to calculate actual superheat.
| Indoor wet-bulb \ Outdoor dry-bulb | 70°F | 80°F | 90°F | 100°F | 110°F |
|---|---|---|---|---|---|
| 55°F IWB | 7.5°F | — | — | — | — |
| 60°F IWB | 15°F | 10°F | 5°F | — | — |
| 65°F IWB | 22.5°F | 17.5°F | 12.5°F | 7.5°F | — |
| 70°F IWB | 30°F | 25°F | 20°F | 15°F | 10°F |
| 75°F IWB | 37.5°F | 32.5°F | 27.5°F | 22.5°F | 17.5°F |
A dash means the formula produces less than 5°F target superheat, where this field method is not reliable.
The formula is supported for roughly 55–115°F outdoor dry-bulb and 50–76°F indoor wet-bulb. If the computed target falls below 5°F, conditions are outside what superheat charging can resolve reliably — verify with the manufacturer’s data instead.
Target Liquid-Line Temperature (TXV Systems)
If the manufacturer gives a target subcooling value, enter the high-side pressure and target subcooling to find the liquid-line temperature you should compare with your clamp reading.
Turn Chart Skills Into a Passing Score
PT chart, superheat, and subcooling calculations show up throughout the EPA 608 and NATE exams. Use the free calculator on this page in the field, then drill the exam versions of these problems — with answer explanations — in our App.
Start Practicing FreePT Chart Practice Problems (Worked Examples)
These are the exact styles of question you will see on EPA 608 and NATE exams. All answers use the same verified data as the chart and calculator above; small differences against other published charts come down to rounding rules.
Example 1: Pressure to Saturation Temperature
“Saturated R-410A at a pressure of 95 PSIG will change state at a temperature of…?”
- Step 1: 95 PSIG falls between the chart rows 87.4 PSIG (25°F) and 97.0 PSIG (30°F).
- Step 2: Interpolate: (95 − 87.4) ÷ (97.0 − 87.4) = 0.79 of the way up a 5°F step ≈ 4°F above 25°F.
- Exam charts that use coarser rounding may list 30°F — go with the chart your exam provides.
Example 2: Working Backwards from Superheat
“The evaporator outlet temperature on an R-410A system is 50°F and the evaporator superheat is 10°F. What is the evaporating pressure?”
- Step 1: Saturation temperature = outlet temperature − superheat = 50°F − 10°F = 40°F.
- Step 2: Convert 40°F to pressure on the R-410A chart.
- The R410A pressure at 40°F saturation is 118.4 PSIG.
Example 3: Condensing Temperature from Head Pressure
“What is the approximate condensing temperature of an R-22 system operating at 195 PSIG?”
- Step 1: 195 PSIG falls between the chart rows 181.8 PSIG (95°F) and 195.9 PSIG (100°F).
- Step 2: 195 PSIG is nearly at the 100°F row, so no math is really needed.
- The interpolated result is about 99.7°F, which rounds to 100°F.
Example 4: R22 Superheat at 76 PSIG
“The R22 evaporating pressure is 76 PSIG and the evaporator outlet temperature is 58°F. What is the evaporator superheat?”
- Step 1: 76 PSIG on the R22 chart is about 45°F saturation temperature.
- Step 2: Superheat = 58°F outlet temperature − 45°F saturation.
- If a compressor-inlet temperature is also supplied, use it separately to calculate total superheat at the compressor.
Example 5: Is R410A at 340 PSIG and 95°F Subcooled?
“R410A liquid-line pressure is 340 PSIG and line temperature is 95°F. Is the refrigerant saturated, superheated or subcooled?”
- Step 1: 340 PSIG is about 105°F condensing saturation temperature.
- Step 2: Subcooling = 105°F saturation − 95°F liquid-line temperature = about 10°F.
Example 6: Target Liquid-Line Temperature
“An R410A system has 365 PSIG head pressure and calls for 10°F subcooling. What liquid-line temperature is the target?”
- Step 1: 365 PSIG corresponds to about 110°F saturation temperature.
- Step 2: Target line temperature = 110°F − 10°F = 100°F.
Want more? Our practice app includes hundreds of PT chart, superheat, and subcooling problems with step-by-step answer explanations — start a free practice test.
Bubble Point vs. Dew Point (The "Glide")
For single-component refrigerants like R-22 or near-azeotropic blends like R-410A, the boiling and condensing temperatures are essentially the same at a given pressure. However, for Zeotropic blends (like R-404A or R-407C), there is a "Temperature Glide." That is why our chart lists separate Liquid/Bubble and Vapor/Dew columns for R-404A.
- Bubble Point (Liquid): Use this when calculating Subcooling.
- Dew Point (Vapor): Use this when calculating Superheat.
Unlike older blends, reading a R-410A PT chart is simple because R-410A has near-zero glide, behaving like a single component.
R-22 vs R-410A: No Drop-In Conversion
The chart above makes the pressure difference obvious: at a 40°F evaporating temperature, R-22 runs about 69 PSIG while R-410A runs about 118 PSIG; at a 105°F condensing temperature it is roughly 211 vs 341 PSIG. R-410A systems operate at about 50–60% higher pressure across the working range.
- Different oil: R-22 systems typically use mineral oil; R-410A requires POE oil. The two lubricants are not interchangeable.
- Different hardware: compressors, coils, and line components on an R-22 system are not rated for R-410A pressures.
- “Conversion charts” are comparison charts. A side-by-side PT table helps you compare readings — it is not a procedure for putting R-410A into an R-22 system. There is no direct drop-in conversion; retrofits require a manufacturer-approved procedure and, usually, a designated retrofit refrigerant.
HVAC P-T Chart FAQ
What is an HVAC P-T chart?
An HVAC P-T chart is a pressure-temperature reference that shows the saturation temperature of a refrigerant at a given pressure. Technicians use it to diagnose charge, superheat, subcooling, and system conditions.
How do I read an R410A pressure temperature chart?
Find the measured R410A pressure in PSIG, then read across to the matching saturation temperature. Use that temperature with your measured line temperature to calculate superheat or subcooling.
What is the difference between superheat and subcooling?
Superheat compares suction line temperature to evaporator saturation temperature. Subcooling compares liquid line temperature to condenser saturation temperature. Both require a pressure-temperature chart reading.
Do I use bubble point or dew point for superheat?
Use dew point for superheat and bubble point for subcooling when working with blends that have temperature glide. R410A has near-zero glide, so the difference is usually minimal.
What is the difference between VSAT and LSAT?
VSAT is vapor saturation temperature, or dew point, and is used for superheat. LSAT is liquid saturation temperature, or bubble point, and is used for subcooling. On near-zero-glide R410A the values are nearly the same; blends with glide can show a meaningful difference.
What is saturation temperature in HVAC?
Saturation temperature is the temperature at which a refrigerant changes phase at a given pressure. On a PT chart every pressure corresponds to one saturation temperature, so technicians read suction or liquid pressure and convert it to a temperature for superheat and subcooling calculations.
What should the high and low side pressures be for R410A?
There is no single normal pressure. Operating pressures depend on outdoor and indoor temperatures, humidity, airflow, equipment efficiency, and the metering device. Instead of chasing a fixed number, measure superheat and subcooling and compare them with the manufacturer's charging data.
Is R410A static pressure the same as running pressure?
No. Static pressure is the equalized saturation pressure of an off system at the refrigerant temperature. Running low- and high-side pressures are created by the operating system and vary with load, airflow, equipment design, metering device and charge.
What is the target superheat for R410A?
On fixed-orifice systems, target superheat is calculated from indoor return wet-bulb and outdoor dry-bulb temperatures; a common field estimate is (3 x IWB - 80 - ODB) / 2. TXV systems are charged by subcooling instead. Manufacturer charging charts always take precedence.
Do I use the target superheat chart on a TXV system?
No. The target superheat chart is for fixed-orifice or piston systems. For a TXV or EEV system, use the manufacturer’s target subcooling and verify that the valve is controlling superheat correctly.
Explore Other Study Guides
Ready to Test Your Knowledge?
Don't just stare at charts. Practice with 1500+real-world questions on our App.
Start Free Practice Test