How to Read an R410A Pressure Chart: High and Low Side Diagnostics
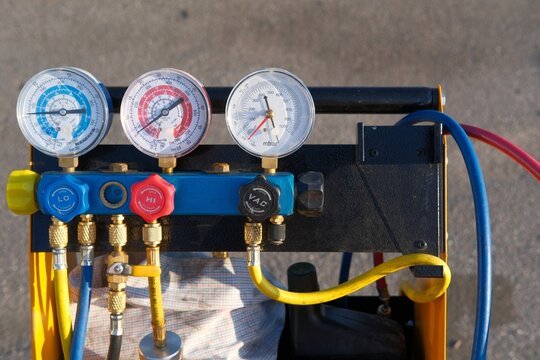
The Ultimate Field Tool for Fast Diagnostics
This R410A pressure chart high and low side guide explains how to interpret suction and liquid-side readings, convert PSIG into saturation temperature, and calculate superheat and subcooling.
There is no single high-side or low-side pressure that is normal for every R410A system. Operating pressures change with indoor load, outdoor temperature, airflow, equipment design, metering device, and the manufacturer’s target superheat or subcooling.
Use the high and low side reference below to understand what each gauge reading represents, then use the complete R410A PT chart to convert measured pressure into saturation temperature. Do not add or remove refrigerant based on pressure alone.
In this 2026 technical guide, we will provide you with a quick-reference PT
⚡ Quick Answer: R410A Pressure Chart High and Low Side
- Low Side: Use suction pressure to find evaporator saturation temperature and calculate superheat.
- High Side: Use liquid-side pressure to find condensing saturation temperature and calculate subcooling.
- Rough 80°F Reference: Approximately 115–130 PSIG on the low side and 275–350 PSIG on the high side.
- Important: These are screening ranges, not charging targets. Final readings depend on indoor load, outdoor temperature, airflow, metering device, and manufacturer specifications.
Never charge an R410A system by pressure alone. Convert pressure to saturation temperature, calculate superheat or subcooling, and compare the result with the equipment data plate or charging instructions.
What Are Normal R410A High and Low Side Pressures?
There is no single “normal” R410A operating pressure that applies to every air-conditioning system. Gauge readings change with outdoor temperature, indoor heat load, airflow, equipment design, and the type of metering device.
As a rough screening reference on an approximately 80°F day with a typical indoor cooling load:
- Low Side (Suction): Approximately 115–130 PSIG
- High Side (Liquid): Approximately 275–350 PSIG
These ranges can help identify a reading that deserves further investigation, but they should not be used as final charging targets. A hot building, restricted airflow, a dirty coil, or changing outdoor conditions can move both readings substantially.
Use the R410A PT chart below to convert each gauge pressure into saturation temperature. Then calculate superheat or subcooling and compare the result with the equipment manufacturer’s charging instructions.
Complete R410A Pressure Temperature (PT) Chart
An R410A PT chart converts refrigerant pressure into saturation temperature. The pressure-temperature relationship is the same on both sides of the system:
- Low side: Use suction pressure to determine evaporator saturation temperature.
- High side: Use liquid-side pressure to determine condensing saturation temperature.
Use the saturation temperature with an actual line-temperature measurement to calculate superheat or subcooling.
| Temp (°F) | R410A Pressure (PSIG) | Temp (°F) | R410A Pressure (PSIG) |
|---|---|---|---|
| -40 | 10.7 | 55 | 156.0 |
| -35 | 14.0 | 60 | 170.1 |
| -30 | 17.7 | 65 | 185.1 |
| -25 | 21.8 | 70 | 201.1 |
| -20 | 26.2 | 75 | 217.9 |
| -15 | 31.0 | 80 | 235.8 |
| -10 | 36.3 | 85 | 254.6 |
| -5 | 42.0 | 90 | 274.5 |
| 0 | 48.2 | 95 | 295.5 |
| 5 | 54.9 | 100 | 317.6 |
| 10 | 62.2 | 105 | 340.9 |
| 15 | 70.0 | 110 | 365.4 |
| 20 | 78.4 | 115 | 391.2 |
| 25 | 87.4 | 120 | 418.3 |
| 30 | 97.0 | 125 | 446.8 |
| 35 | 107.3 | 130 | 476.8 |
| 40 | 118.4 | 135 | 508.3 |
| 45 | 130.1 | 140 | 541.4 |
| 50 | 142.6 | 145 | 576.3 |
| — | — | 150 | 613.0 |
Values are rounded for field reference. Use the refrigerant manufacturer’s current PT data and the equipment manufacturer’s service instructions when making charging decisions.
Using the Low Side: Finding Your Superheat
When you connect the blue hose to the suction service port, you are measuring the low side of the system. Use that pressure to determine the evaporator saturation temperature.
For a fixed-orifice or piston system, superheat is commonly used as part of the charging procedure. It also helps confirm whether refrigerant vapor returning to the compressor is sufficiently above its saturation temperature.
Step 1: Read the low-side pressure. In this example, the gauge reads approximately 118.4 PSIG.
Step 2: Find 118.4 PSIG on the R410A PT chart. It corresponds to an evaporator saturation temperature of approximately 40°F.
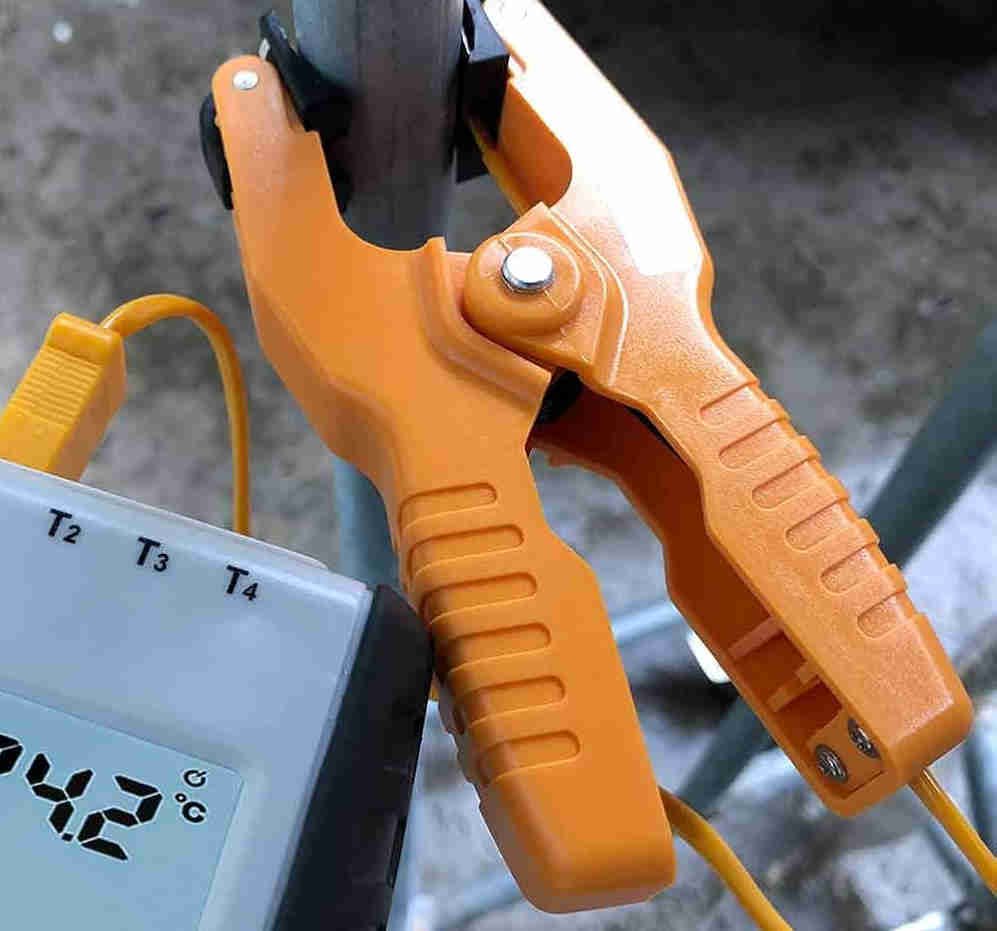
Step 3: Measure the suction-line temperature near the service port. In this example, it is 52°F.
Step 4: Subtract saturation temperature from suction-line temperature:
52°F − 40°F = 12°F superheat
A 12°F reading is the calculated superheat, but it is not automatically the correct target for every system. Compare it with the manufacturer’s charging chart, which may use indoor wet-bulb and outdoor dry-bulb temperatures to determine the required superheat.
If you need a more detailed walkthrough, read our guide on how to calculate superheat.
Using the High Side: Finding Your Subcooling
On many systems equipped with a TXV, refrigerant charge is verified using the manufacturer’s target subcooling rather than using superheat as the primary charging method. Superheat can still provide valuable diagnostic information.
Use the red gauge to read the liquid-side pressure and convert it to condensing saturation temperature.
Step 1: Read the high-side pressure. In this example, the gauge reads approximately 317.6 PSIG.
Step 2: Find 317.6 PSIG on the R410A PT chart. It corresponds to a condensing saturation temperature of approximately 100°F.
Step 3: Measure the liquid-line temperature. In this example, it is 90°F.
Step 4: Subtract liquid-line temperature from condensing saturation temperature:
100°F − 90°F = 10°F subcooling
The calculated subcooling must then be compared with the target printed on the equipment data plate or listed in the manufacturer’s charging instructions. Do not assume that 10°F is correct for every system.
Advanced Diagnostics: Leak vs. Restriction
Superheat and subcooling patterns can narrow the list of possible faults, but they should not be treated as proof of a single failure. Confirm airflow, system load, line temperatures, metering-device operation, and manufacturer specifications before making a final diagnosis.
Scenario A: Low Subcooling + High Superheat
This pattern often indicates that the evaporator is being starved. A low refrigerant charge is one possible cause, but it should not be declared a leak from gauge readings alone.
Check next: Confirm airflow, inspect for obvious restrictions, verify temperature measurements, and perform an appropriate leak search before adding refrigerant.
Scenario B: High Subcooling + High Superheat
This combination can indicate that liquid refrigerant is backing up in the condenser while the evaporator is being starved. Possible causes include a restricted liquid-line filter drier, a restricted metering device, an improperly installed TXV sensing bulb, or a TXV that is not feeding correctly.
Check next: Measure the temperature drop across the filter drier, inspect the TXV bulb and equalizer, and compare the readings with the manufacturer’s diagnostic procedure.
Scenario C: Normal Subcooling + Low Superheat
This pattern can indicate low evaporator load, reduced indoor airflow, or an overfeeding metering device. It does not automatically prove that the system has the correct refrigerant charge.
Check next: Inspect the air filter and evaporator coil, verify blower speed and total airflow, measure indoor wet-bulb temperature, and check the metering device.
Important: Pressure, superheat, and subcooling must be interpreted together. Verify the operating conditions before adding or recovering refrigerant.
🛠️ Stop Guessing the Charge
Reading a chart is only step one. Can you diagnose a bad TXV under pressure? Test your practical skills with our advanced troubleshooting simulator.
The R410A Phase-Down and A2L Refrigerants
R410A remains common in existing equipment, while many newer systems are moving to lower-GWP A2L refrigerants such as R-454B and R-32.
The principles of superheat and subcooling remain the same, but each refrigerant has its own pressure-temperature relationship. Always select the correct refrigerant on your gauges or digital manifold and use the PT data specified for that refrigerant.
EPA Section 608 certification still applies when technicians service equipment in a way that could release regulated refrigerant. The EPA does not issue a separate federal certification specifically for R410A. Technicians working with A2L equipment should also follow manufacturer training, current safety standards, employer requirements, and applicable state or local codes.
Related: Prepare for the industry transition by reading our A2L Certification Guide.
Use the R410A Pressure Chart Without Guessing
An R410A pressure chart is a conversion tool, not a complete charging diagnosis. Pressure alone cannot confirm whether a system is correctly charged.
Use the same process every time:
- Read the correct low-side or high-side pressure.
- Convert that pressure into saturation temperature.
- Measure the corresponding suction-line or liquid-line temperature.
- Calculate superheat or subcooling.
- Compare the result with the equipment manufacturer’s target.
If the readings do not agree, verify airflow, operating conditions, and measurement accuracy before adding or recovering refrigerant. This process produces a more reliable diagnosis and reduces unnecessary callbacks or compressor damage.
📱 Ace Your Technical Exams
Access 1,500+ advanced diagnostic and calculation questions directly in your browser. Master the NATE scenarios today.

0 Comments