The Ultimate HVAC Pressure Temperature Chart Directory (2026 Updated)
The Most Important Tool in Your Phone
Are you looking for an accurate pressure temperature chart to save on your phone for everyday field diagnostics? You have come to the perfect place.
In the HVAC industry, guessing is a guaranteed way to destroy a compressor. You cannot determine if an air conditioning system is properly charged just by looking at the pressure on your gauges. 100 PSI might be overcharged on a cold day, or severely undercharged on a hot day.
To truly understand what is happening inside the sealed copper lines, you must convert pressure into saturation temperature.
In this 2026 master directory, we have compiled the ultimate reference guides for the most common modern refrigerants. We will break down how to read an hvac pressure temperature chart, explain the tricky concept of “temperature glide,” and show you how to use this data to pass your certification exams.
📊 Test Your Thermodynamics
Do you know how to find target subcooling? Take a quick diagnostic quiz to verify your refrigeration cycle logic.
What Exactly is Saturation?
Before we look at the numbers, you need to understand the science. According to fundamental thermodynamics recognized by organizations like ASHRAE, saturation is the exact point where a refrigerant changes state.
It is the moment liquid boils into a vapor (in the evaporator), or vapor condenses back into a liquid (in the condenser).
When you look at a pressure temperature chart, the temperature listed is the saturation point. If the actual temperature of the copper pipe is higher than the chart says it should be, you have Superheat. If the actual temperature is lower than the chart says, you have Subcooling.
Understanding Glide: Bubble Point vs. Dew Point
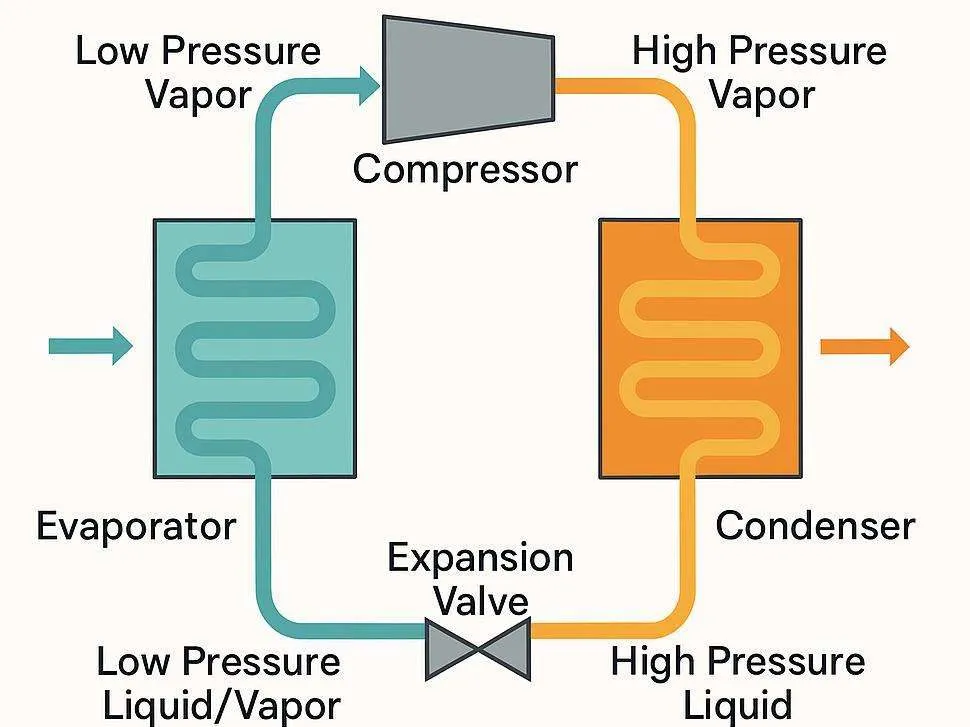
If you are working with pure refrigerants (like the old R-22 or the highly flammable R-290), using a pressure temp chart is easy. One pressure equals one temperature.
However, modern systems use 400-series blended refrigerants (like R-407C or MO99). These blends are made of different chemicals that boil at different temperatures. This creates a “Glide.”
When looking at a modern refrigerant temp pressure chart, you will see two columns for blended refrigerants:
- Bubble Point (Liquid): Use this column when checking the High Side (Liquid Line) to calculate Subcooling.
- Dew Point (Vapor): Use this column when checking the Low Side (Suction Line) to calculate Superheat.
If you mix these up, your calculations will be wrong, and you will misdiagnose the system.
Resource: Working with pure propane? Check out our dedicated R-290 Safety Guide and Chart.
Quick Reference PT Charts for 2026
Here are the abbreviated quick-reference charts for the three most common refrigerants you will encounter in the field today.
R-410A (The Modern Standard)
R-410A is a near-azeotropic blend. It has a tiny glide (about 0.3°F), so for field purposes, we treat it like a pure refrigerant with a single column.
| Temp (°F) | Pressure (PSIG) | Temp (°F) | Pressure (PSIG) | |
| 35° | 107 | 85° | 276 | |
| 40° | 118 | 95° | 317 | |
| 45° | 130 | 105° | 360 | |
| 50° | 142 | 115° | 408 |
Deep Dive: Read our full R-410A High & Low Side Diagnostic Guide.
R-32 (The A2L Future)
As the EPA phases down high-GWP refrigerants, R-32 is replacing R-410A in 2026. It operates at very similar, slightly higher pressures.
| Temp (°F) | Pressure (PSIG) | Temp (°F) | Pressure (PSIG) | |
| 35° | 111 | 85° | 283 | |
| 40° | 122 | 95° | 325 | |
| 45° | 134 | 105° | 370 | |
| 50° | 147 | 115° | 419 |
R-134a (Medium Temp & Automotive)
Still heavily used in medium-temperature commercial refrigeration and older automotive air conditioning.
| Temp (°F) | Pressure (PSIG) | Temp (°F) | Pressure (PSIG) | |
| 20° | 18 | 85° | 95 | |
| 30° | 26 | 95° | 114 | |
| 40° | 35 | 105° | 134 | |
| 50° | 45 | 115° | 157 |
🛠️ Don’t Just Read the Chart, Use It
Can you calculate superheat under pressure? The NATE exams will test your math. Practice interactive scenarios now.
Using the Chart to Pass Your Exams
In the field, you can pull up a pressure temperature chart on your phone at any time. But in the testing center, things are different.
When you sit for your EPA 608 Certification or your state Journeyman license, you are not allowed to bring your phone. The exam proctor will typically provide you with a clean, printed copy of a standard PT chart.
You must know how to read it quickly.
Many technicians fail their exams because they confuse the bubble point and dew point columns when answering questions about blended refrigerants (like the old R-22 drop-ins). You must practice reading these charts and executing the basic subtraction math over and over again until it becomes muscle memory.
Frequently Asked Questions (FAQ)
Q: Is there a universal pressure temperature chart?
A: No. Every chemical refrigerant has unique thermodynamic properties. You must use the specific chart corresponding to the exact refrigerant gas loaded in the system.
Q: Do digital manifold gauges replace the need for a chart?
A: In the field, yes. High-end digital gauges have built-in microprocessors containing the saturation data for over 80 refrigerants. They calculate your superheat instantly. However, you must still know how to read a physical chart to pass your certification exams.
Q: Why is my actual line temperature different from the chart?
A: The chart only tells you the saturation (boiling) temperature. The actual temperature of the copper pipe will be different because the gas has either gained sensible heat (Superheat) or lost sensible heat (Subcooling) after changing states.
Conclusion: Train Your Brain
A high-quality pressure temperature chart is the ultimate map of the refrigeration cycle. It tells you exactly what the invisible gases are doing inside those copper pipes.
If you want to transition from being a simple parts-changer to a highly paid master diagnostician, you must learn to trust the math. Read the pressures, find the saturation temp, and calculate your target charge.
Ready to prove your thermodynamic mastery?
Don’t wait until exam day to realize you forgot the formula. Start training your brain right now.
📱 Ace Your Industry Certifications
Access 1,500+ updated questions covering the exact topics found on the EPA 608 and NATE certification exams. Start practicing directly in your browser.

0 Comments